UX / UI Case Study · Mobile Product Layer
Making public monitoring feel readable, visible, and trustworthy.
I designed a public-facing mobile product layer that helps people understand nuclear wastewater monitoring through clearer status communication, visible source comparison, and public-facing explanation.
The project focuses on how interface design can make environmental monitoring systems easier for ordinary people to read and trust.
What this project does
Not just a dashboard. A way to explain the system behind the numbers.
The goal was not only to display measurement data, but to help non-expert users understand what the data means, where it comes from, and why it should be trusted.
Context
Why this became a trust problem instead of only a data problem.
In 2023, when Japan began releasing treated Fukushima wastewater into the Pacific, public reaction across East Asia showed that technical reassurance alone was not enough.
August 2023 · News signal
China suspended Japanese aquatic imports after the discharge began.
The event quickly moved beyond technical reporting. A scientific issue was now experienced publicly as a trust issue.
Seoul · Public reaction
South Korea saw protests, anxiety, and public questions about seafood safety.
Even when institutions used technical language, public feeling was shaped by uncertainty, emotion, and doubt.
Design insight
The gap was not only in data accuracy, but in how the system could be understood.
That turned the issue into an interaction design question: how might an interface help people read, verify, and understand the system behind the data?
System logic
I designed the platform as a reading path, from quick status to deeper trust.
Instead of treating this as one dashboard screen, I structured it as a sequence: signal, detail, verification, and public explanation.
Start with status
The overview answers the most urgent question first by showing the current condition, the main reading, and the larger regional context.
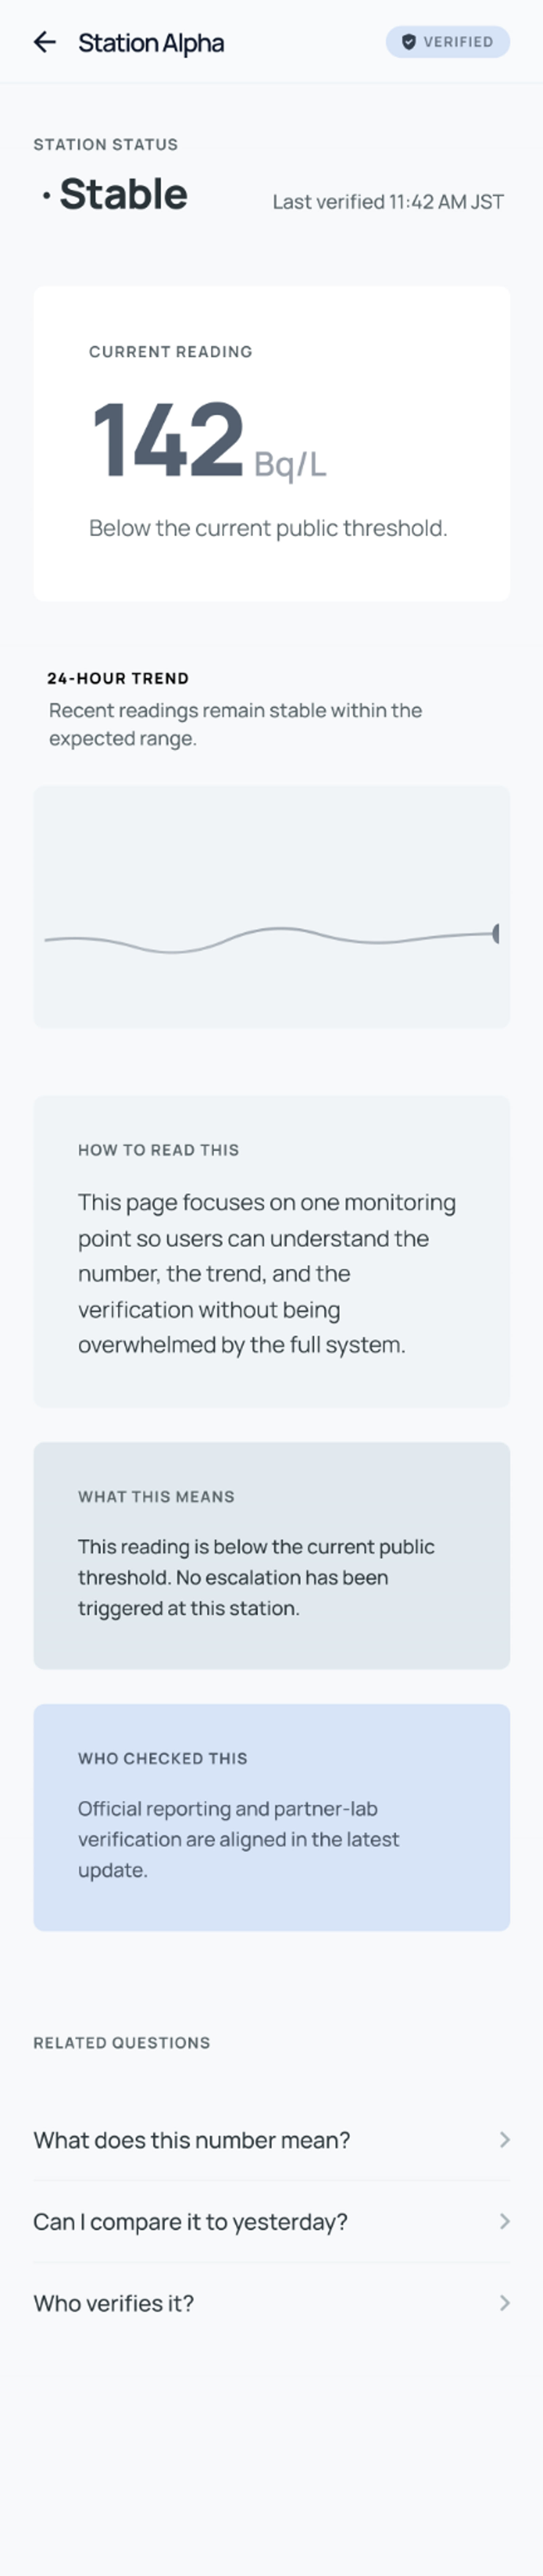
Move into one station
The detail page turns one raw number into something readable through threshold context, trend, and verification time.
Check who verified it
The sources page makes trust more visible by showing that more than one institution is involved in checking the data.
Answer public concerns
The community page gives the system a public-facing layer, so explanation and participation sit alongside reporting.
Build trust as interaction
The final structure reframes trust as something supported by interface clarity, visible verification, and accessible explanation.
How the design helps
It gives the public three things they usually do not get from technical reporting.
Immediate readability
Instead of starting with raw measurement language, the interface begins with clear status, threshold context, and a readable visual hierarchy.
Visible verification
Users can see that the system is checked across official and partner sources, reducing reliance on a single authority statement.
Public explanation
Questions, concerns, and plain-language interpretation are treated as part of the product itself, not as something outside it.
UI Showcase
A four-screen mobile system designed to make monitoring easier to read, compare, and question.
The screens move from overview, to station detail, to verification, to public-facing explanation.
Screen flow
Four linked screens, one trust-building path
Each interface layer answers a different kind of public concern. Together they form a product system rather than a single information board.
Reflection
This project reframed trust as an interface problem.
Instead of asking whether the public should simply accept technical reassurance, I asked how design could make the system itself feel more visible.
The final outcome is a product concept that turns monitoring into something people can read, compare, and question.
Trust is not only built by the data itself, but by whether people can understand how the system works.